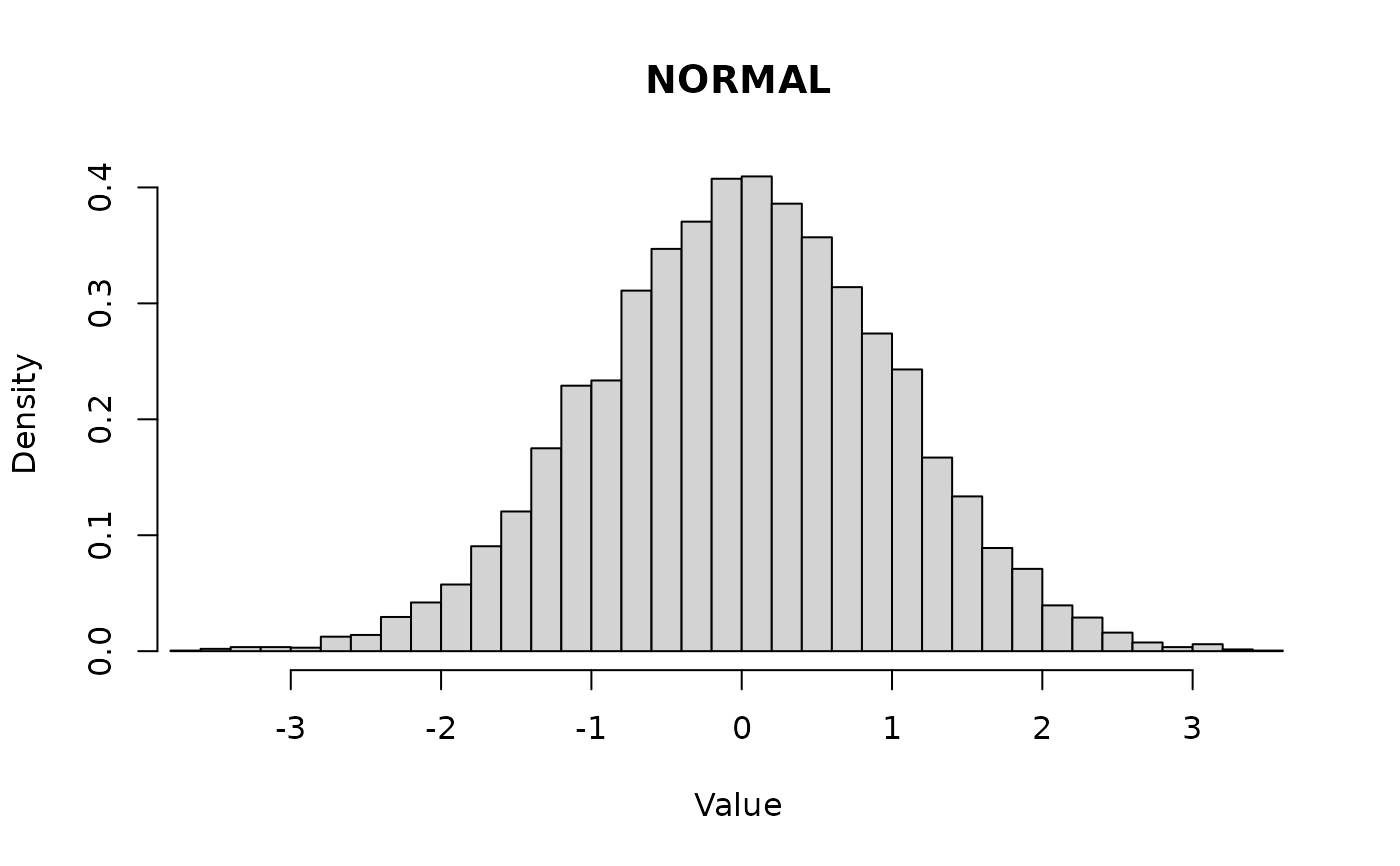
Plot an histogram of the density of the distribution using random numbers from the distribution
Usage
# S3 method for class 'DISTRIBUTION'
plot(x, n = 10000, ...)
Arguments
- x
an object of class
DISTRIBUTION- n
number of observations
- ...
other parameters to the
histfunction
Examples
x <- new_NORMAL(0,1)
plot(x)

y <- new_DIRICHLET(c(10,20,70))
plot(x)
y <- new_DIRICHLET(c(10,20,70))
plot(x)
