Plot of DISTRIBUTION objects using ggplot2
Arguments
- x
an object of class
DISTRIBUTION- n
number of observation
Value
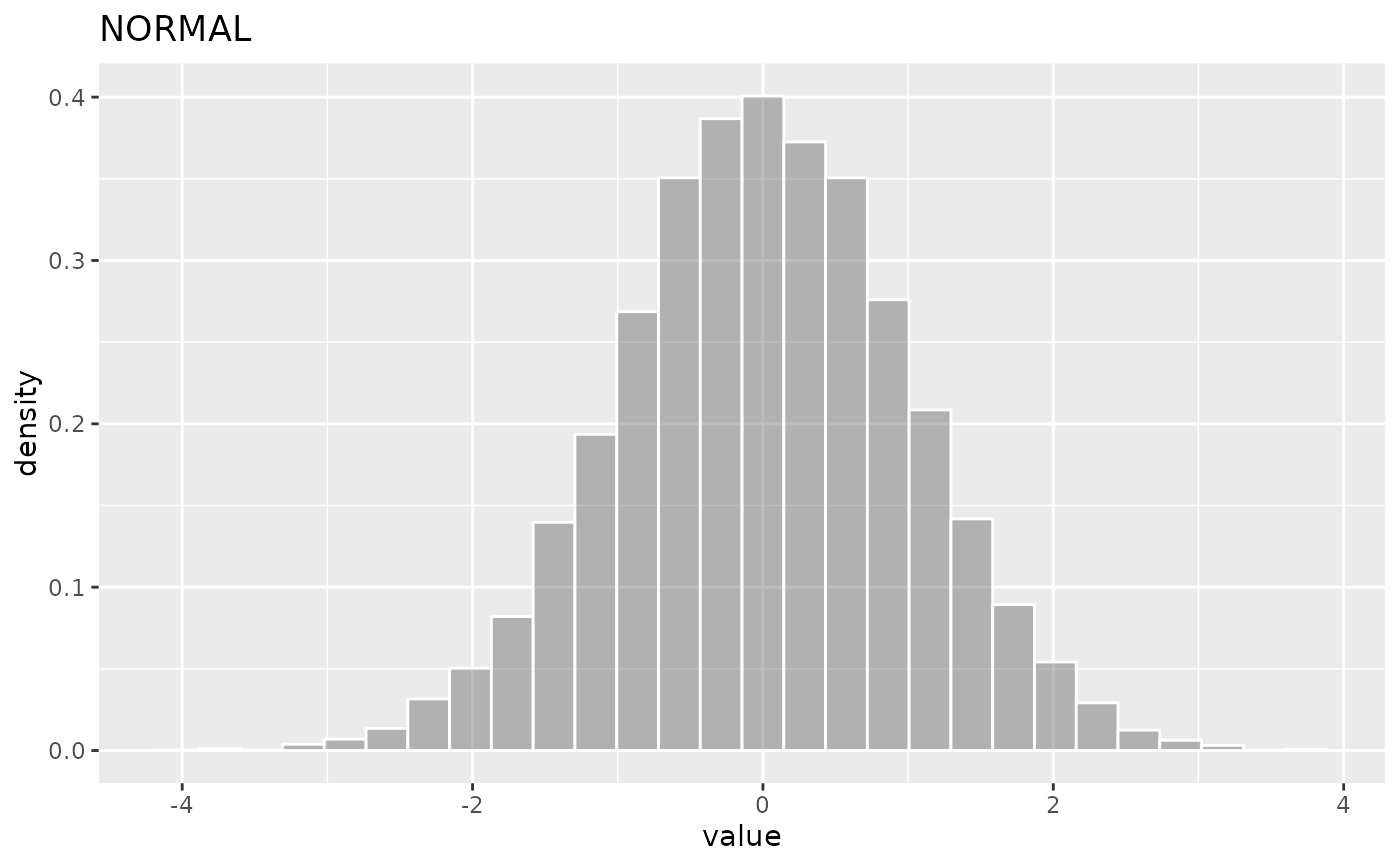
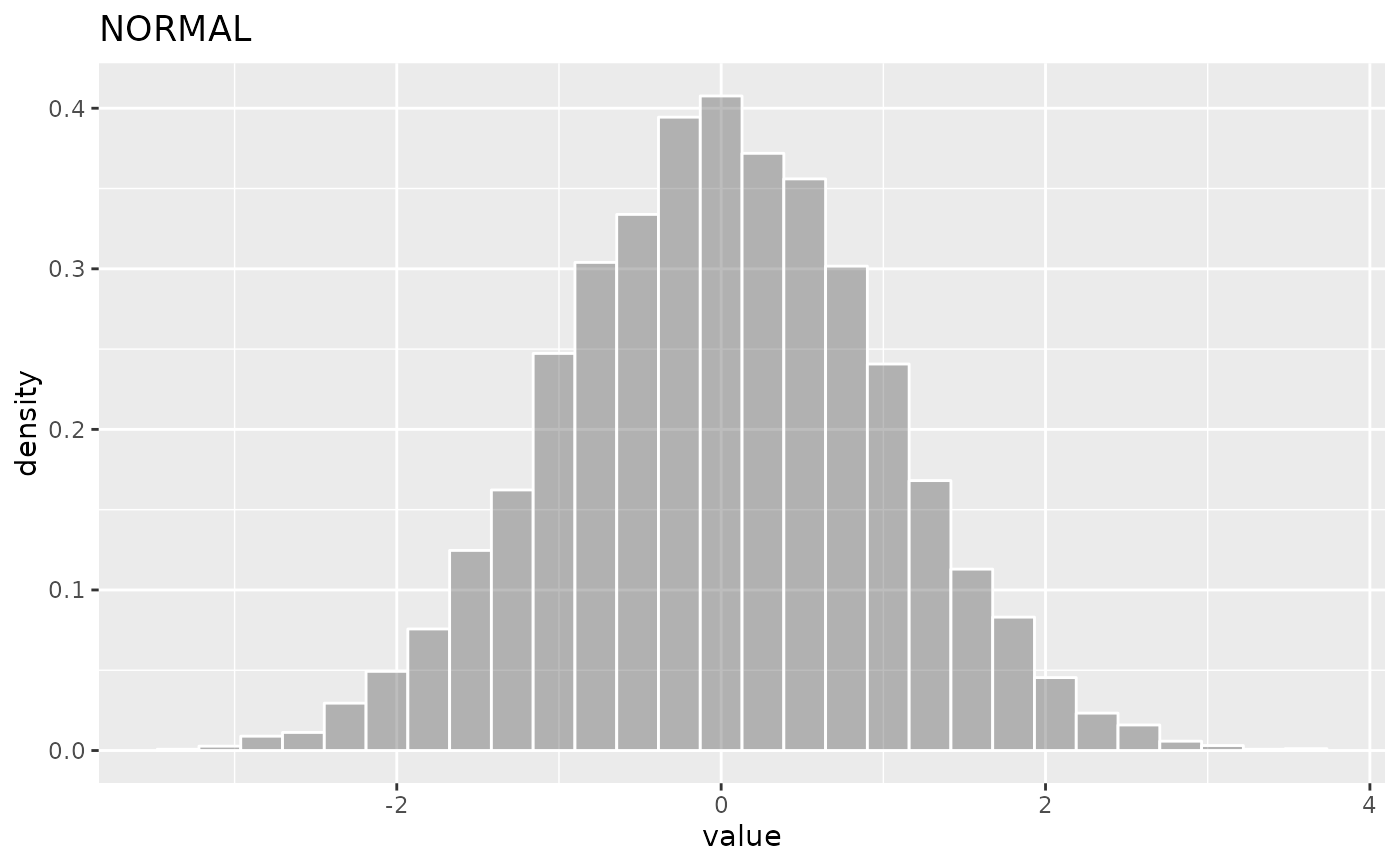
a ggplot object with the density of the distribution
Examples
x <- new_NORMAL(0,1)
ggDISTRIBUTION(x)

y <- new_DIRICHLET(c(10,20,70))
ggDISTRIBUTION(x)
y <- new_DIRICHLET(c(10,20,70))
ggDISTRIBUTION(x)